Add WayPoint to Your System to Add Profits and Boost Cash-Flow!
WayPoint Analytics adds over one hundred expert-designed cost and profit reports to your existing system. Immediately get new profits without the need for new sales. You can make more money — a LOT more.
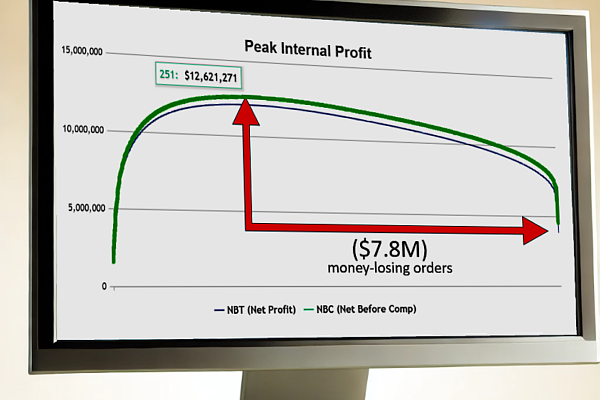
Where Did the Profits Go?


How WayPoint Brings Profits Back
Profit Conversion Rates are the Key to Sales Strategy & Growth
Only with WayPoint can you see the customers and products that convert revenue to profit at rates well above the norm.
Best Strategies for New Profits

Focus on High-Profit Accounts

Eradicate Small Orders
Correct Pricing Anomalies
You're Making More Money Than You Know

How WayPoint Works
You Have Customers Delivering Profit at 4× Your Company Rate
WayPoint shows who and how much – your team can maximize high-profit sales right away.
What You Can Do With WayPoint
Optimize Costs Efficiently
Enhance Productivity
Boost Efficiency
Comprehensive Insights
Profit Analysis
Data Precision
Why WayPoint is the Most-Chosen Solution


Our Clients Get Strategy Briefings
The "Small Order Problem" Has Been Around for Decades
It's why your profits have dropped and WayPoint will show you exactly how to solve it.
One Simple Pricing Trick Adds $100,000 to Your Bottom Line
WayPoint will give you what you need to get it done in a few days – we'll show you how.
8 Highly Effective Strategies
1. Focus on High Revenue-to-Profit Conversion Customers
Target customers with the highest revenue-to-profit conversion rates for quick profit boosts.
While your company may convert only 5% of overall revenue into profit, certain customers convert 20% or more. Increasing sales with these high-performing customers can rapidly grow profits and cash flow. WayPoint's Profit Value Segmentation model highlights these key accounts, helping you focus on them for immediate and lasting profit gains.
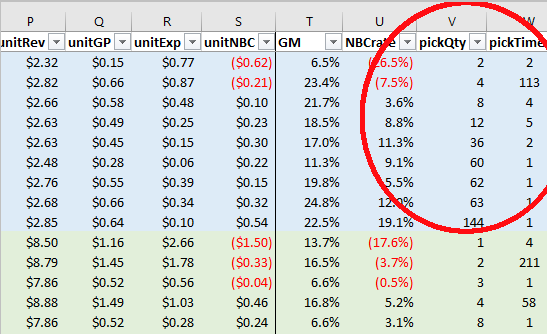
2. Eliminate Losses from Small Orders
Address systemic losses from small, unprofitable orders that erode overall profits.
Small orders that cost more to process than they generate are a persistent issue, dragging down profit margins. WayPoint identifies the customer groups that generate the majority of these orders, allowing you to implement margin increases and policy changes. These changes can boost profits by 50% or more, leading to sustainable, long-term improvements in profit rates.
3. Implement Minimum Order Quantities (MOQs)
Use Minimum Order Quantities (MOQs) to avoid sales that can't cover costs, boosting profitability.
Rising labor costs and shortages have increased the threshold for profitable order sizes. WayPoint's tools analyze the "all-in" costs of every line item on an invoice, showing profit margins at different quantity levels. The analysis includes shipping costs, rebates, and location-specific operating costs. Eliminating low-value sales at unprofitable quantities can increase company profit rates by 50% or more—a unique power offered by WayPoint.
4. Leverage Low Cost-to-Serve Customers for Growth
Target low-cost-to-serve customers to maximize profitability and focus on acquiring similar accounts.
While typical accounts may cost your company 20% of revenue to serve, there is a group of elite customers with much lower service costs and higher-than-average profit rates. WayPoint's Profit Value Segmentation identifies these top performers, allowing your sales team to target similar high-potential prospects, narrowing their focus to accounts that can outperform competitors and drive profitable growth.
5. Use NBC (Net Before Compensation) to Align Sales with Profit
Align sales and commissions with actual profits, not misleading margins.
WayPoint calculates the true profit on every invoice line using NBC (Net Before Compensation), which accounts for both margins and real costs. This helps companies understand which sales are truly profitable and prevent decisions based on misleading margin data. Many companies have started aligning their commissions with NBC, which has become a key metric in nearly all WayPoint analyses.
6. Convert Large Loss-Making Accounts to Profitability
Identify and resolve profit-draining issues in large accounts.
Certain large accounts may be responsible for significant losses due to frequent small orders or structural imbalances between margins and costs. WayPoint identifies these accounts and pinpoints where the losses are coming from, offering actionable strategies your team can use to convert them into profit-generating relationships.
7. Boost Operational Efficiency with ROX (Return on Expenditures)
Increase manpower productivity and operational efficiency to lower costs.
Improving the productivity of your workforce can reduce operational costs while handling more product value. WayPoint analyzes all aspects of your operations, and its exclusive ROX (Return on Expenditures) metric provides detailed comparisons of cost efficiency across locations, product lines, and time periods. This allows you to operate at a lower cost than your competitors, enhancing overall productivity and profitability.
8. Maximize Rebates for Extra Profit
Increase rebate income to drive additional profit from purchasing agreements.
Rebates can provide a significant boost to the bottom line. WayPoint tracks the impact of rebates on customer and product profitability, and its Vendor Relationship analysis gives you the same insights used by Fortune 500 buying groups. By using WayPoint's tools, distributors can improve purchasing decisions and maximize rebates, turning professional purchasing into a profit-generating function.
Leverage Operations for Profit Gains


Optimize Transport Costs
The Ideal Target List for the Best New Accounts is in Your Data
We'll Show You Where.
Frequently Asked Questions
What is WayPoint Analytics?
WayPoint Analytics is an advanced cost and profit analysis platform designed specifically for distributors. It enables companies to understand the true profitability of customers, products, and orders by providing detailed insights into hidden costs that affect their bottom line.
How does WayPoint Analytics help distributors increase profitability?
WayPoint Analytics helps distributors increase profitability by identifying hidden costs in areas such as logistics, small orders, and inefficient customer relationships. It provides actionable insights that allow businesses to make data-driven decisions, reducing waste and improving overall margins.
How is WayPoint different from my ERP system?
While ERP systems typically focus on tracking revenues and gross profits, WayPoint Analytics goes beyond by analyzing logistics, handling, delivery, and compensation costs. This means you get a detailed understanding of Net Before Compensation (NBC), which gives you a more accurate picture of true profitability.
What is NBC (Net Before Compensation)?
NBC represents the operating profit after most expenses, such as logistics and overhead, are deducted from the gross profit. It is a more accurate reflection of profitability than gross margin alone, allowing businesses to see exactly where they are making or losing money.
How quickly can I expect results with WayPoint?
Most companies start seeing measurable results within the first few weeks of implementation. By using WayPoint's powerful analytics tools, businesses can identify unprofitable areas quickly and make the necessary adjustments to increase profit.
Does WayPoint integrate with my existing systems?
Yes, WayPoint Analytics integrates easily with your existing ERP and accounting systems. This allows for a seamless flow of data from your current platform into WayPoint, where you can start gaining deeper insights without disrupting your operations.
Introducing WayPoint Prophet AI
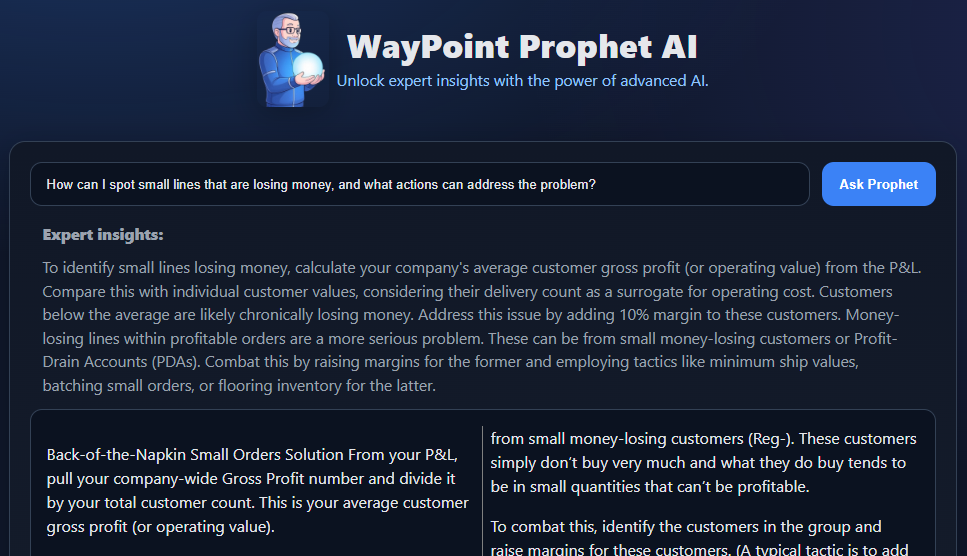
Expert AI Insights

Smarter Decision Making
Maximize Profits
This is WayPoint...
×FREE Strategy Videos
×Click to see these strategy videos:
FREE Profit Strategy Guides
×Click to download these strategy guides:
Pricing for WayPoint
×We'll Show It to You...
×You can be making money at a whole new level.